Edit chart
Loading graph
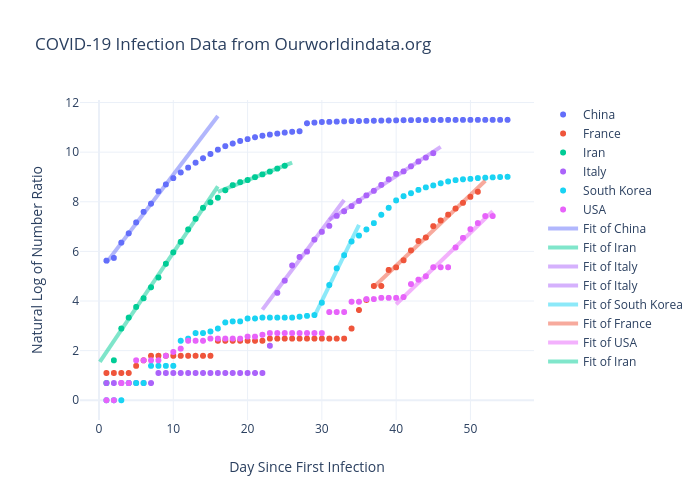
Rhettallain's interactive graph and data of "COVID-19 Infection Data from Ourworldindata.org" is a scatter chart, showing China, France, Iran, Italy, South Korea, USA; with Day Since First Infection in the x-axis and Natural Log of Number Ratio in the y-axis.. The x-axis shows values from -2.336172120125504 to 58.336172120125504. The y-axis shows values from -0.7866038790612695 to 12.102327151340255.