Edit chart
Loading graph
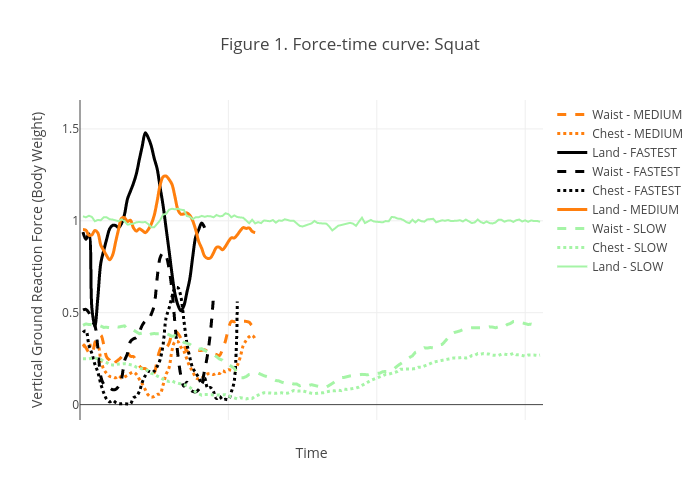
Ross36's interactive graph and data of "Figure 1. Force-time curve: Squat" is a line chart, showing Waist - MEDIUM, Chest - MEDIUM, Land - FASTEST, Waist - FASTEST, Chest - FASTEST, Land - MEDIUM, Waist - SLOW, Chest - SLOW, Land - SLOW; with Time in the x-axis and Vertical Ground Reaction Force (Body Weight) in the y-axis.. The x-axis shows values from 0 to 156. The y-axis shows values from -0.08278865584858981 to 1.6395020811232064. This visualization has the following annotations: Medium; Fastest