Edit chart
Loading graph
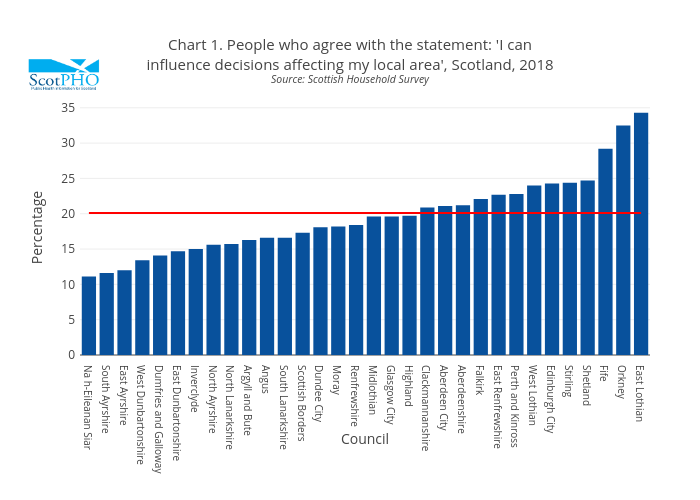
Scotpho's interactive graph and data of "Chart 1. People who agree with the statement: 'I caninfluence decisions affecting my local area', Scotland, 2018Source: Scottish Household Survey" is a bar chart, showing Council vs Scotland; with Council in the x-axis and Percentage in the y-axis.. The x-axis shows values from 0 to 0. The y-axis shows values from 0 to 0.