Edit chart
Loading graph
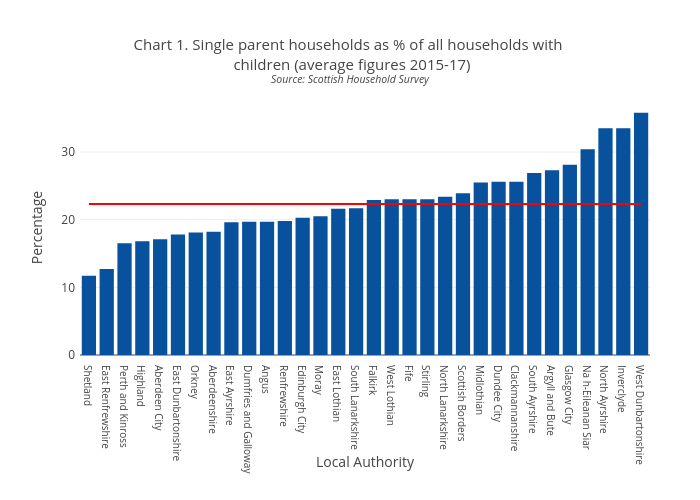
Scotpho's interactive graph and data of "Chart 1. Single parent households as % of all households with children (average figures 2015-17)Source: Scottish Household Survey" is a bar chart, showing Local Authority vs Scotland; with Local Authority in the x-axis and Percentage in the y-axis.. The x-axis shows values from 0 to 0. The y-axis shows values from 0 to 0.