Edit chart
Loading graph
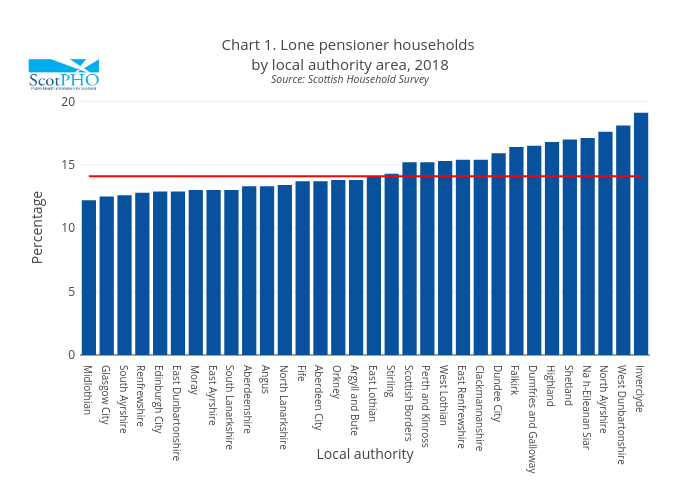
Scotpho's interactive graph and data of "Chart 1. Lone pensioner households by local authority area, 2018Source: Scottish Household Survey" is a bar chart, showing Local authority vs Scotland; with Local authority in the x-axis and Percentage in the y-axis.. The x-axis shows values from 0 to 0. The y-axis shows values from 0 to 0.