Edit chart
Loading graph
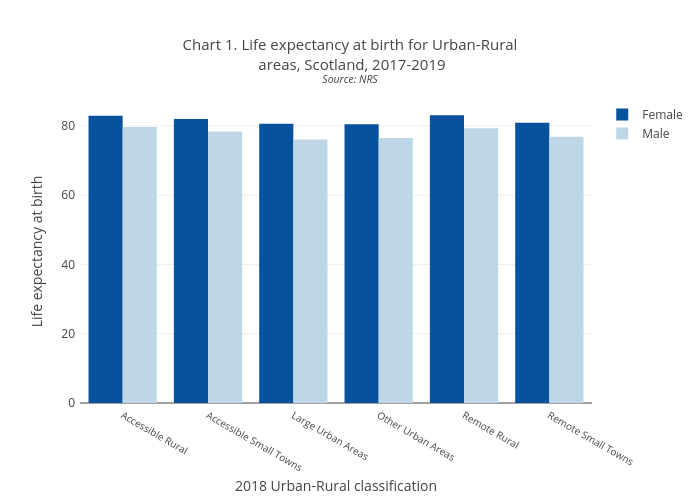
Scotpho's interactive graph and data of "Chart 1. Life expectancy at birth for Urban-Rural areas, Scotland, 2017-2019Source: NRS" is a bar chart, showing Female vs Male; with 2018 Urban-Rural classification in the x-axis and Life expectancy at birth in the y-axis.. The x-axis shows values from 0 to 0. The y-axis shows values from 0 to 0.