Edit chart
Loading graph
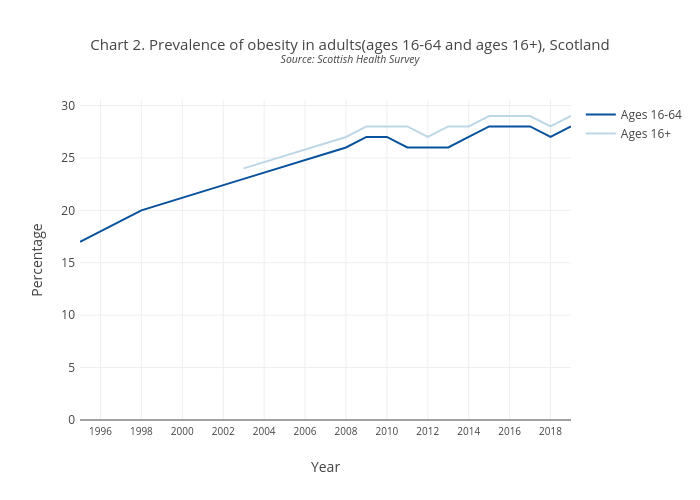
Scotpho's interactive graph and data of "Chart 2. Prevalence of obesity in adults(ages 16-64 and ages 16+), ScotlandSource: Scottish Health Survey" is a line chart, showing Ages 16-64 vs Ages 16+; with Year in the x-axis and Percentage in the y-axis.. The x-axis shows values from 0 to 0. The y-axis shows values from 0 to 0.