Edit chart
Loading graph
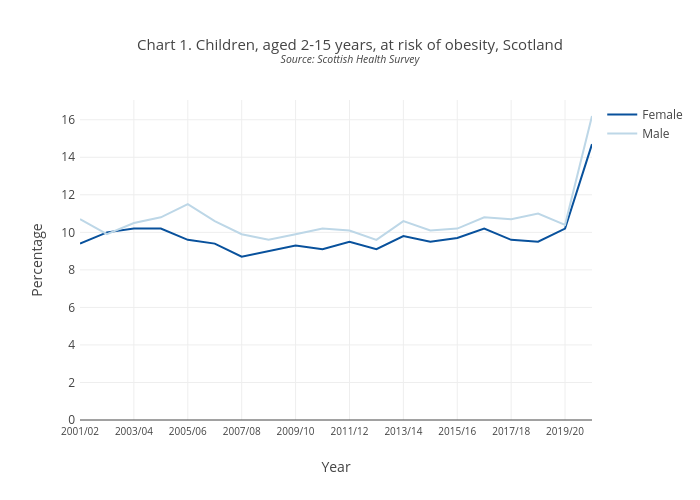
Scotpho's interactive graph and data of "Chart 1. Children, aged 2-15 years, at risk of obesity, ScotlandSource: Scottish Health Survey" is a line chart, showing Female vs Male; with Year in the x-axis and Percentage in the y-axis.. The x-axis shows values from 0 to 0. The y-axis shows values from 0 to 0.