Edit chart
Loading graph
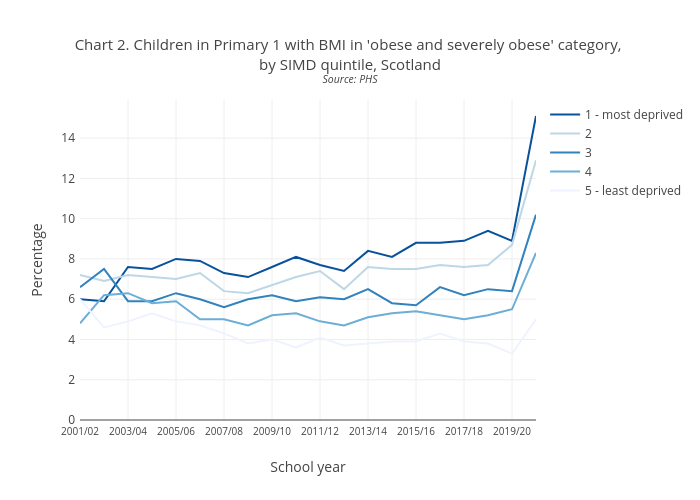
Scotpho's interactive graph and data of "Chart 2. Children in Primary 1 with BMI in 'obese and severely obese' category, by SIMD quintile, ScotlandSource: PHS" is a line chart, showing 1 - most deprived, 2, 3, 4, 5 - least deprived; with School year in the x-axis and Percentage in the y-axis.. The x-axis shows values from 0 to 0. The y-axis shows values from 0 to 0.