Edit chart
Loading graph
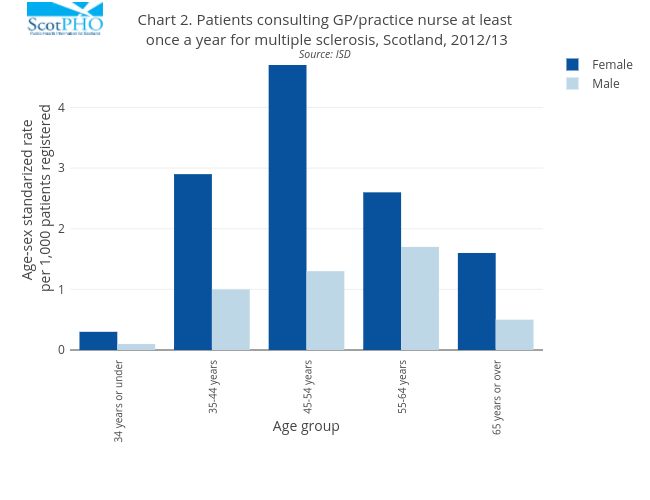
Scotpho's interactive graph and data of "Chart 2. Patients consulting GP/practice nurse at least once a year for multiple sclerosis, Scotland, 2012/13Source: ISD" is a bar chart, showing Female vs Male; with Age group in the x-axis and Age-sex standarized rate per 1,000 patients registered in the y-axis.. The x-axis shows values from 0 to 0. The y-axis shows values from 0 to 0.