Edit chart
Loading graph
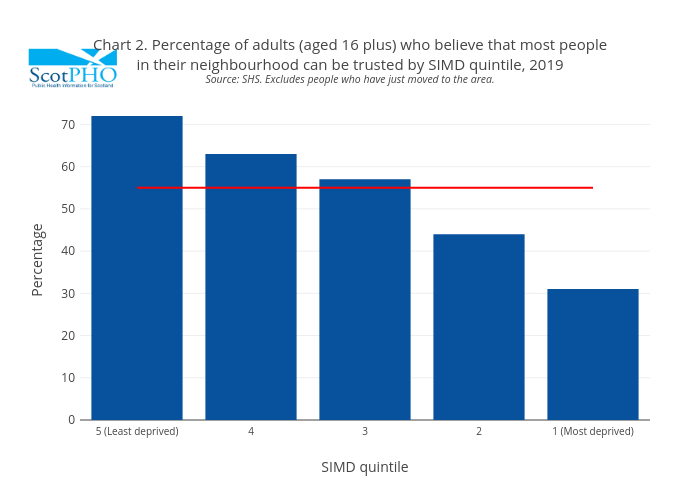
Scotpho's interactive graph and data of "Chart 2. Percentage of adults (aged 16 plus) who believe that most peoplein their neighbourhood can be trusted by SIMD quintile, 2019Source: SHS. Excludes people who have just moved to the area." is a bar chart, showing SIMD quintile vs Scotland; with SIMD quintile in the x-axis and Percentage in the y-axis.. The x-axis shows values from 0 to 0. The y-axis shows values from 0 to 0.