Edit chart
Loading graph
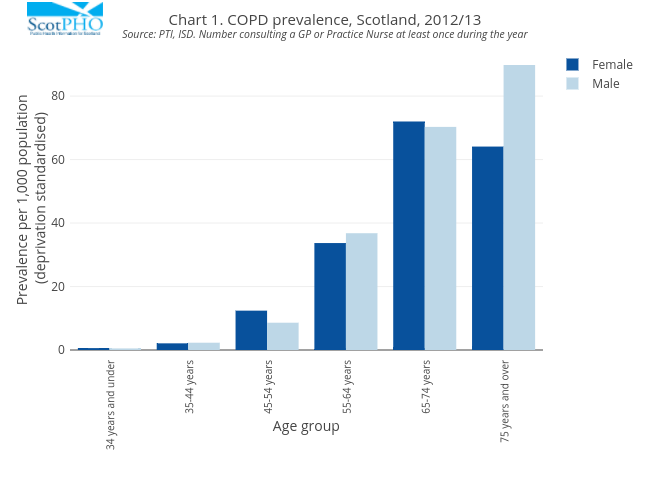
Scotpho's interactive graph and data of "Chart 1. COPD prevalence, Scotland, 2012/13Source: PTI, ISD. Number consulting a GP or Practice Nurse at least once during the year" is a bar chart, showing Female vs Male; with Age group in the x-axis and Prevalence per 1,000 population (deprivation standardised) in the y-axis.. The x-axis shows values from 0 to 0. The y-axis shows values from 0 to 0.