Edit chart
Loading graph
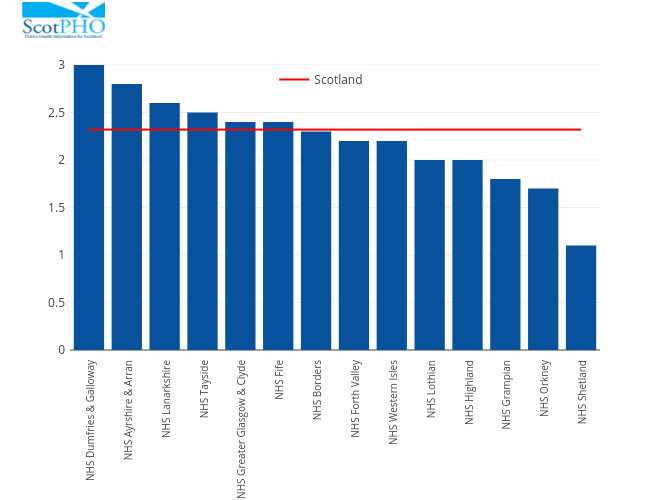
Scotpho's interactive graph and data of "Chart 1. COPD prevalence rate per 100 patientsregistered with a GP Practice, 2015/16Source: QOF, ISD Scotland. Practices with new GMS contracts" is a bar chart, showing NHS Board vs Scotland; with NHS Board in the x-axis and Crude prevalence rate per 100 patients in the y-axis.. The x-axis shows values from -0.5 to 13.5. The y-axis shows values from 0 to 3.1578947368421053.