Edit chart
Loading graph
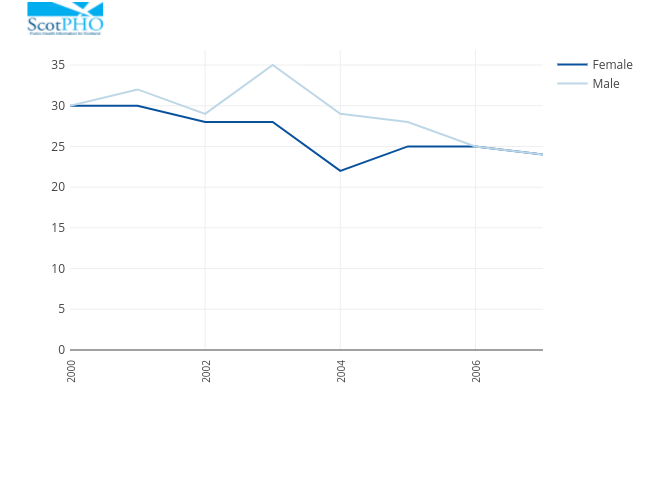
Scotpho's interactive graph and data of "Chart 2. Smoking rates by gender, ScotlandSource: General Household Survey" is a line chart, showing Female vs Male; with Year in the x-axis and Percentage who are current smokers in the y-axis.. The x-axis shows values from 2000 to 2007. The y-axis shows values from 0 to 36.8421052631579.