Edit chart
Loading graph
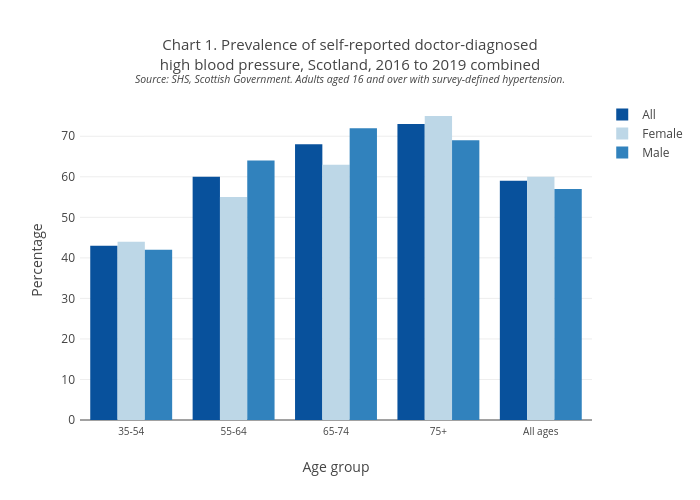
Scotpho's interactive graph and data of "Chart 1. Prevalence of self-reported doctor-diagnosedhigh blood pressure, Scotland, 2016 to 2019 combinedSource: SHS, Scottish Government. Adults aged 16 and over with survey-defined hypertension." is a bar chart, showing All, Female, Male; with Age group in the x-axis and Percentage in the y-axis.. The x-axis shows values from 0 to 0. The y-axis shows values from 0 to 0.