Edit chart
Loading graph
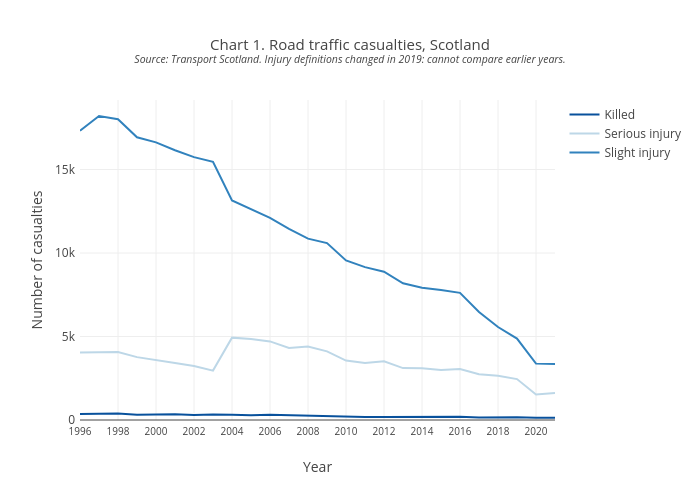
Scotpho's interactive graph and data of "Chart 1. Road traffic casualties, ScotlandSource: Transport Scotland. Injury definitions changed in 2019: cannot compare earlier years." is a line chart, showing Killed, Serious injury, Slight injury; with Year in the x-axis and Number of casualties in the y-axis.. The x-axis shows values from 0 to 0. The y-axis shows values from 0 to 0.