Edit chart
Loading graph
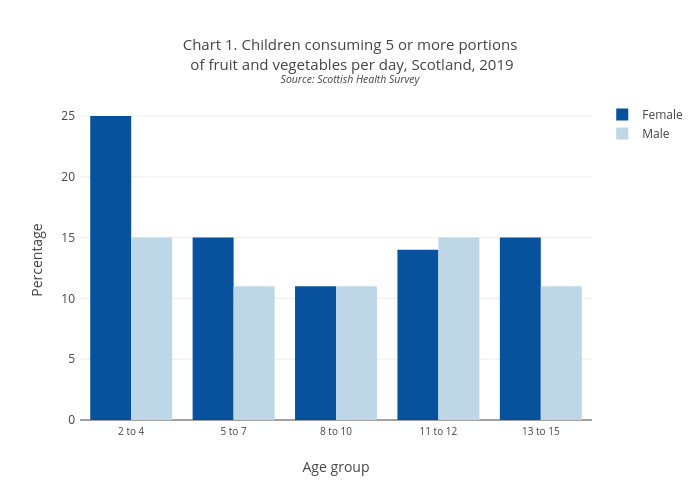
Scotpho's interactive graph and data of "Chart 1. Children consuming 5 or more portions of fruit and vegetables per day, Scotland, 2019Source: Scottish Health Survey" is a bar chart, showing Female vs Male; with Age group in the x-axis and Percentage in the y-axis.. The x-axis shows values from 0 to 0. The y-axis shows values from 0 to 0.