Edit chart
Loading graph
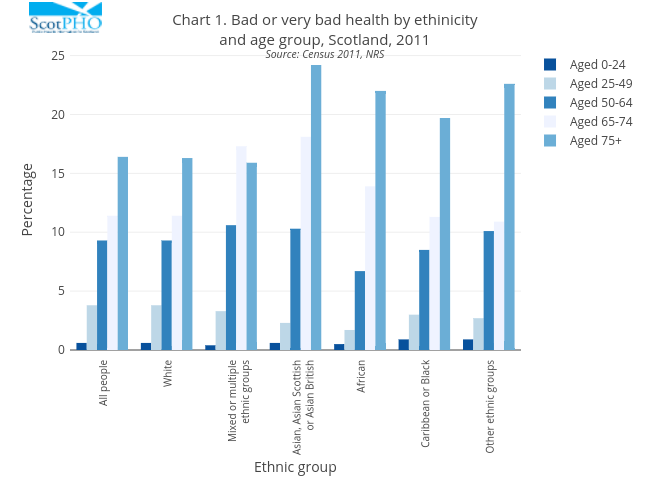
Scotpho's interactive graph and data of "Chart 1. Bad or very bad health by ethinicityand age group, Scotland, 2011Source: Census 2011, NRS" is a bar chart, showing Aged 0-24, Aged 25-49, Aged 50-64, Aged 65-74, Aged 75+; with Ethnic group in the x-axis and Percentage in the y-axis.. The x-axis shows values from 0 to 0. The y-axis shows values from 0 to 0.