Edit chart
Loading graph
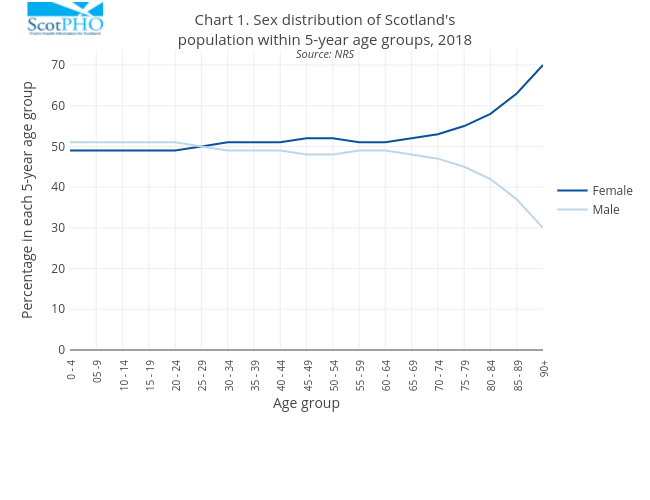
Scotpho's interactive graph and data of "Chart 1. Sex distribution of Scotland'spopulation within 5-year age groups, 2018Source: NRS" is a line chart, showing Female vs Male ; with Age group in the x-axis and Percentage in each 5-year age group in the y-axis.. The x-axis shows values from 0 to 0. The y-axis shows values from 0 to 0.