Edit chart
Loading graph
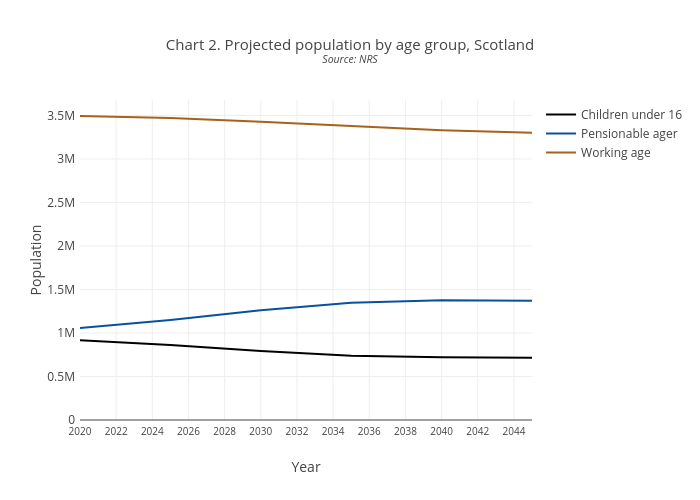
Scotpho's interactive graph and data of "Chart 2. Projected population by age group, ScotlandSource: NRS" is a line chart, showing Children under 16, Pensionable ager, Working age; with Year in the x-axis and Population in the y-axis.. The x-axis shows values from 0 to 0. The y-axis shows values from 0 to 0.