Edit chart
Loading graph
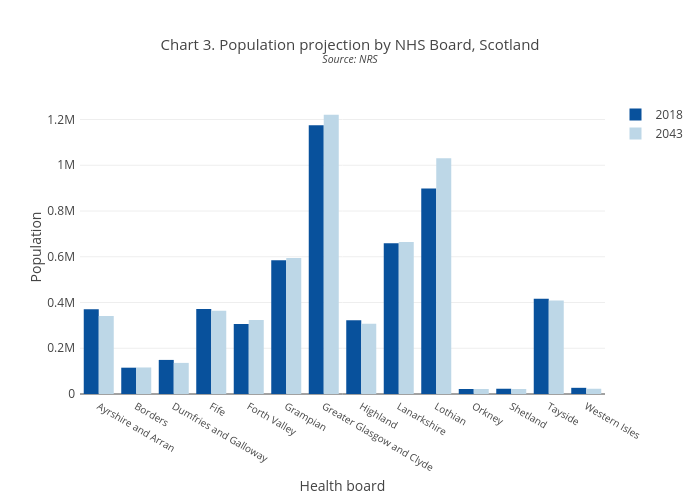
Scotpho's interactive graph and data of "Chart 3. Population projection by NHS Board, ScotlandSource: NRS" is a bar chart, showing 2018 vs 2043; with Health board in the x-axis and Population in the y-axis.. The x-axis shows values from 0 to 0. The y-axis shows values from 0 to 0.