Edit chart
Loading graph
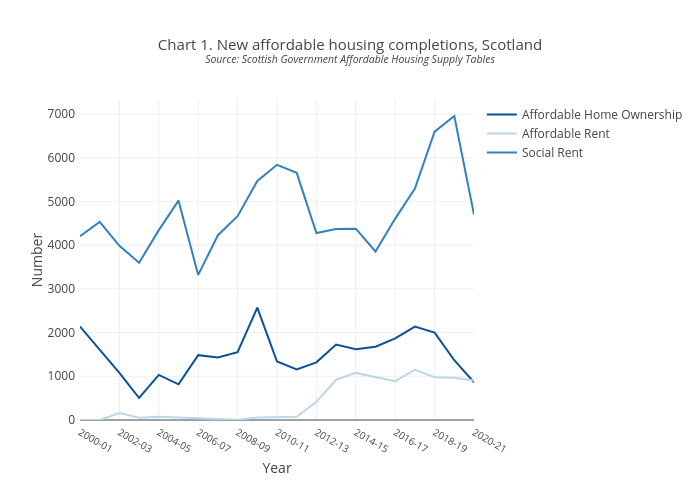
Scotpho's interactive graph and data of "Chart 1. New affordable housing completions, ScotlandSource: Scottish Government Affordable Housing Supply Tables" is a line chart, showing Affordable Home Ownership, Affordable Rent, Social Rent; with Year in the x-axis and Number in the y-axis.. The x-axis shows values from 0 to 0. The y-axis shows values from 0 to 0.