Edit chart
Loading graph
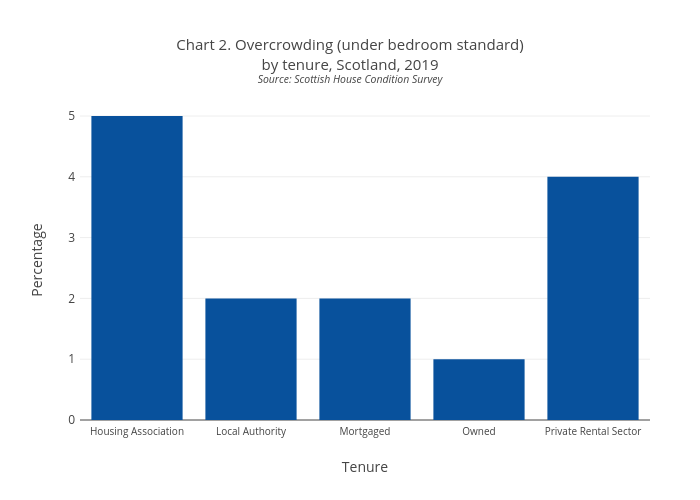
Scotpho's interactive graph and data of "Chart 2. Overcrowding (under bedroom standard)by tenure, Scotland, 2019Source: Scottish House Condition Survey" is a bar chart; with Tenure in the x-axis and Percentage in the y-axis.. The x-axis shows values from 0 to 0. The y-axis shows values from 0 to 0.