Edit chart
Loading graph
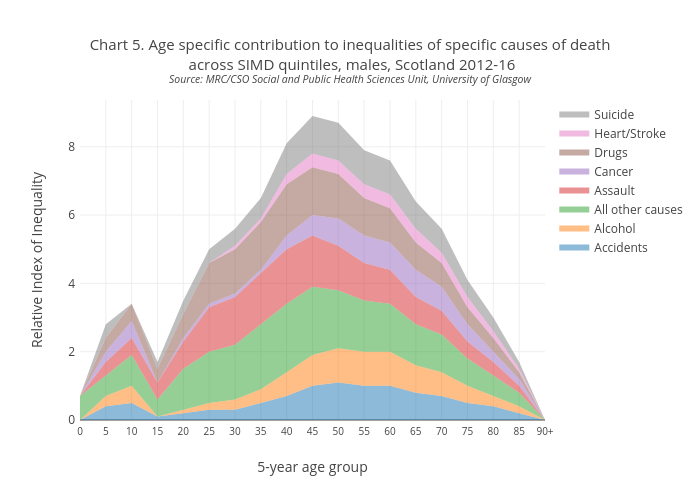
Scotpho's interactive graph and data of "Chart 5. Age specific contribution to inequalities of specific causes of death across SIMD quintiles, males, Scotland 2012-16Source: MRC/CSO Social and Public Health Sciences Unit, University of Glasgow" is a , showing Accidents, Alcohol, All other causes, Assault, Cancer, Drugs, Heart/Stroke, Suicide; with 5-year age group in the x-axis and Relative Index of Inequality in the y-axis.. The x-axis shows values from 0 to 0. The y-axis shows values from 0 to 0.