Edit chart
Loading graph
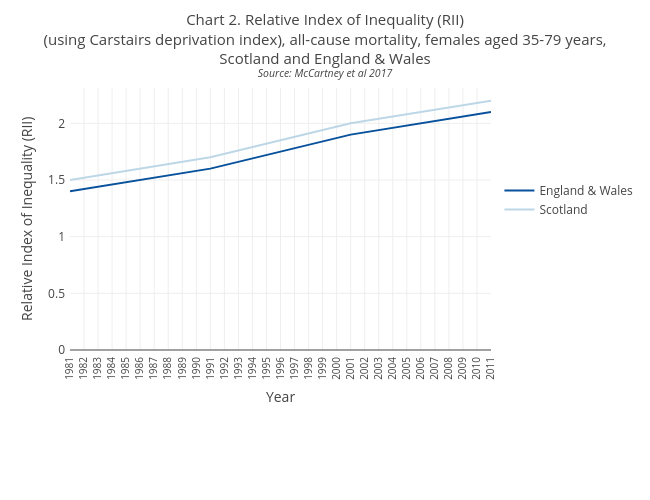
Scotpho's interactive graph and data of "Chart 2. Relative Index of Inequality (RII)(using Carstairs deprivation index), all-cause mortality, females aged 35-79 years,Scotland and England & WalesSource: McCartney et al 2017" is a line chart, showing England & Wales vs Scotland; with Year in the x-axis and Relative Index of Inequality (RII) in the y-axis.. The x-axis shows values from 1981 to 2011. The y-axis shows values from 0 to 2.3157894736842106.