Edit chart
Loading graph
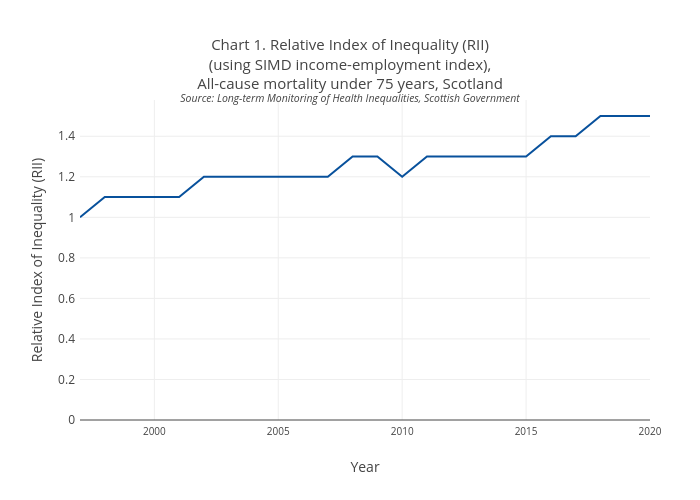
Scotpho's interactive graph and data of "Chart 1. Relative Index of Inequality (RII)(using SIMD income-employment index),All-cause mortality under 75 years, ScotlandSource: Long-term Monitoring of Health Inequalities, Scottish Government" is a line chart; with Year in the x-axis and Relative Index of Inequality (RII) in the y-axis.. The x-axis shows values from 0 to 0. The y-axis shows values from 0 to 0.