Edit chart
Loading graph
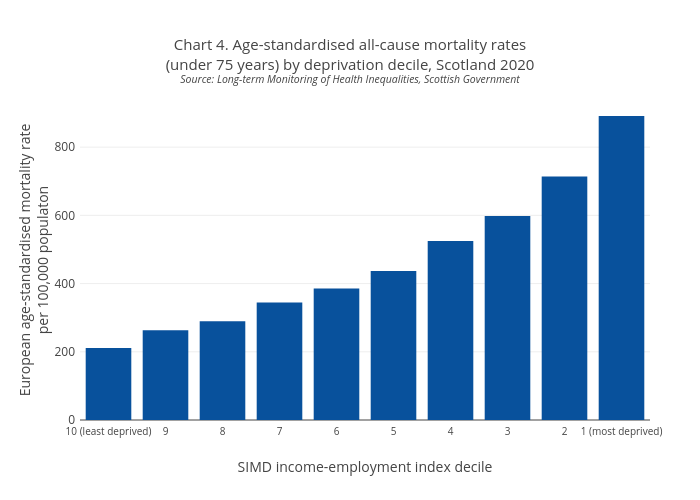
Scotpho's interactive graph and data of "Chart 4. Age-standardised all-cause mortality rates(under 75 years) by deprivation decile, Scotland 2020Source: Long-term Monitoring of Health Inequalities, Scottish Government" is a bar chart; with SIMD income-employment index decile in the x-axis and European age-standardised mortality rateper 100,000 populaton in the y-axis.. The x-axis shows values from 0 to 0. The y-axis shows values from 0 to 0.