Edit chart
Loading graph
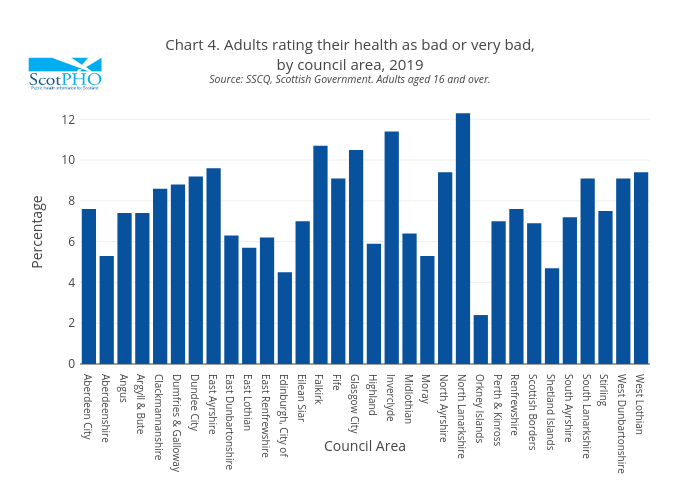
Scotpho's interactive graph and data of "Chart 4. Adults rating their health as bad or very bad,by council area, 2019Source: SSCQ, Scottish Government. Adults aged 16 and over." is a bar chart; with Council Area in the x-axis and Percentage in the y-axis.. The x-axis shows values from 0 to 0. The y-axis shows values from 0 to 0.