Edit chart
Loading graph
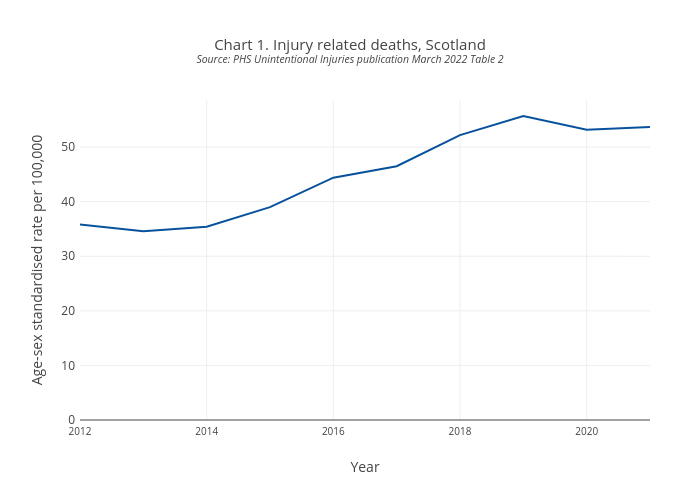
Scotpho's interactive graph and data of "Chart 1. Injury related deaths, ScotlandSource: PHS Unintentional Injuries publication March 2022 Table 2" is a line chart; with Year in the x-axis and Age-sex standardised rate per 100,000 in the y-axis.. The x-axis shows values from 0 to 0. The y-axis shows values from 0 to 0.