Edit chart
Loading graph
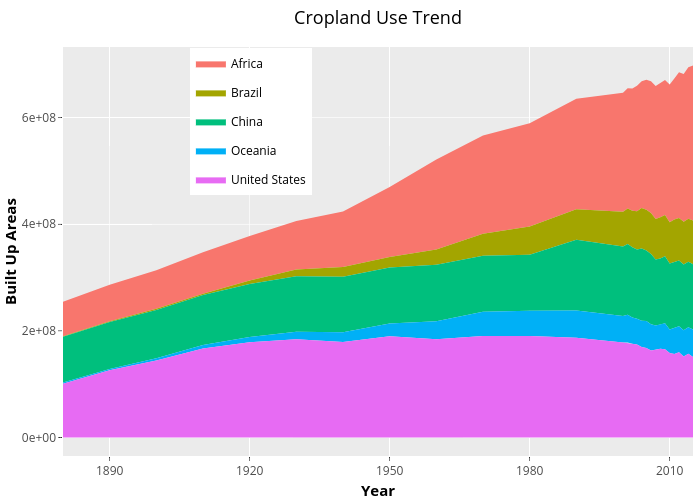
Simmie's interactive graph and data of "Cropland Use Trend" is a filled line chart, showing Africa, Brazil, China, Oceania, United States; with Year in the x-axis and Built Up Areas in the y-axis.. The x-axis shows values from 1880 to 2015. The y-axis shows values from -34887472.35 to 732636919.35. This visualization has the following annotation: Entity