Edit chart
Loading graph
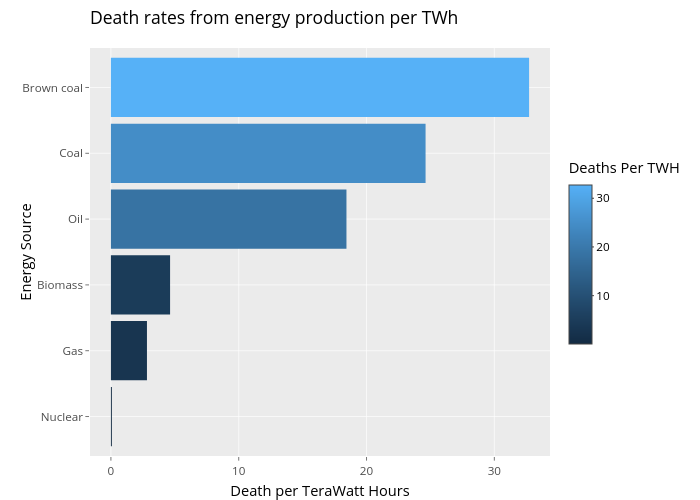
Simmie's interactive graph and data of "Death rates from energy production per TWh" is a , showing 99_23c08b8f4ff04c09913434aede021a6e; with Death per TeraWatt Hours in the x-axis and Energy Source in the y-axis.. The x-axis shows values from -1.636 to 34.356. The y-axis shows values from 0.4 to 6.6.