Edit chart
Loading graph
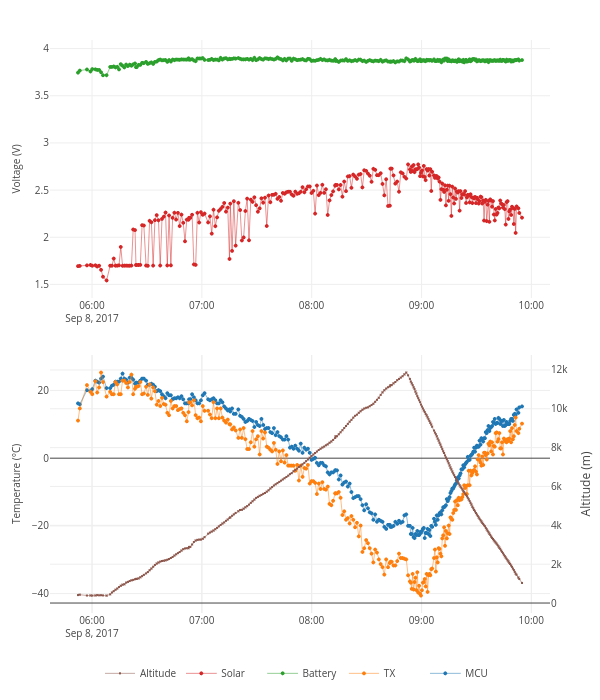
Tomastt7's interactive graph and data of "MCU, TX, Battery, Solar, Altitude" is a line chart, showing MCU, TX, Battery, Solar, Altitude; with Temperature (°C) in the y-axis. The x-axis shows values from 2017-09-08 05:37:02.2432 to 2017-09-08 10:10:10.7568. The y-axis shows values from -45.232808041934845 to 29.932808041934845.