Edit chart
Loading graph
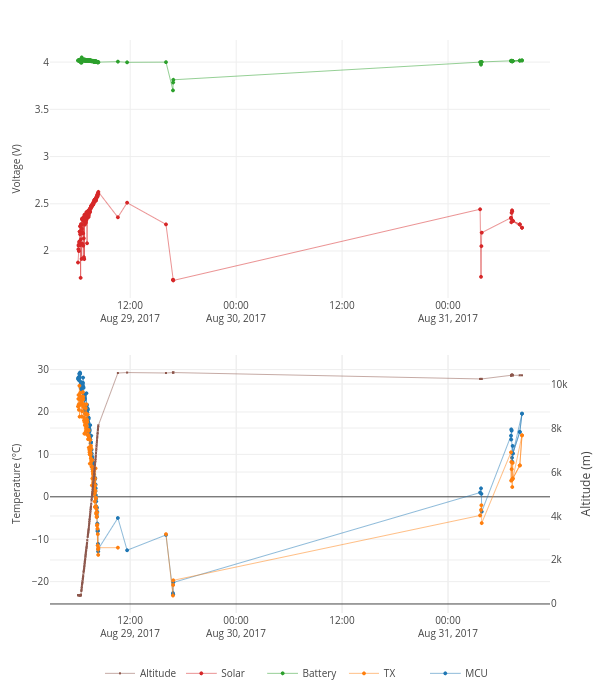
Tomastt7's interactive graph and data of "MCU, TX, Battery, Solar, Altitude" is a line chart, showing MCU, TX, Battery, Solar, Altitude; with Temperature (°C) in the y-axis. The x-axis shows values from 2017-08-29 02:54:42.7387 to 2017-08-31 11:33:00.2613. The y-axis shows values from -26.997810364275765 to 32.997810364275765.