Edit chart
Loading graph
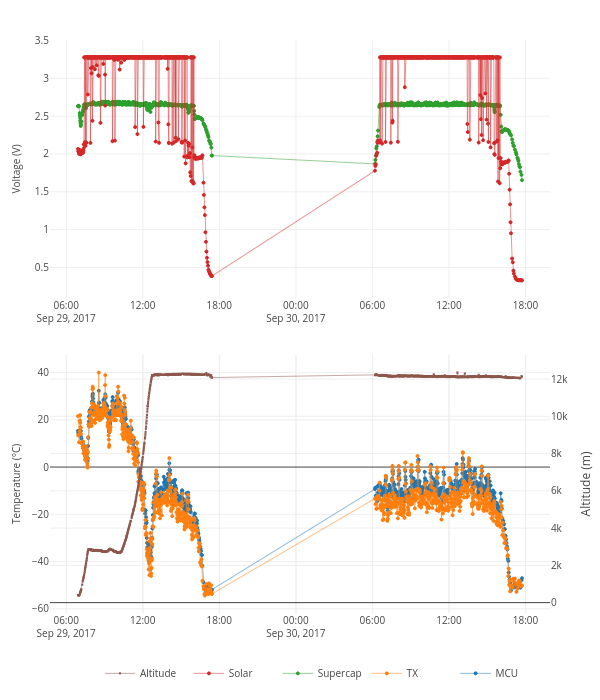
Tomastt7's interactive graph and data of "MCU, TX, Supercap, Solar, Altitude" is a line chart, showing MCU, TX, Supercap, Solar, Altitude; with Temperature (°C) in the y-axis. The x-axis shows values from 2017-09-29 04:43:20.5856 to 2017-09-30 19:54:39.4144. The y-axis shows values from -61.03637449406144 to 46.63637449406144.