Edit chart
Loading graph
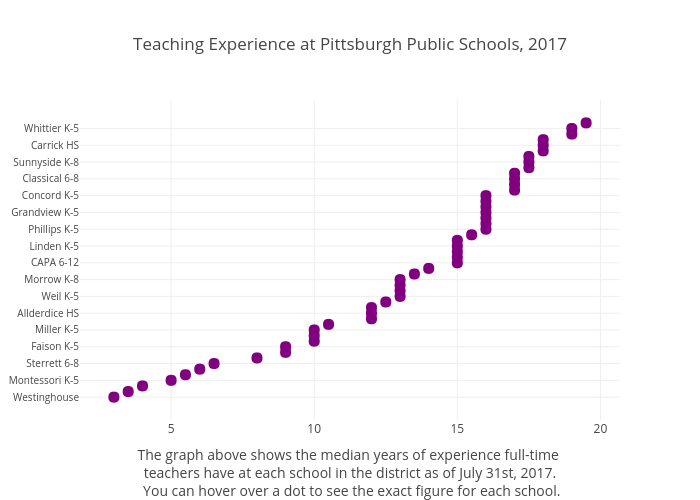
Zacharygoldstein's interactive graph and data of "Teaching Experience at Pittsburgh Public Schools, 2017" is a scatter chart, showing y; with The graph above shows the median years of experience full-time teachers have at each school in the district as of July 31st, 2017. You can hover over a dot to see the exact figure for each school. in the x-axis. The x-axis shows values from 1.8876620352402393 to 20.61233796475976. The y-axis shows values from -4.0870556061987235 to 53.087055606198724.