Edit chart
Loading graph
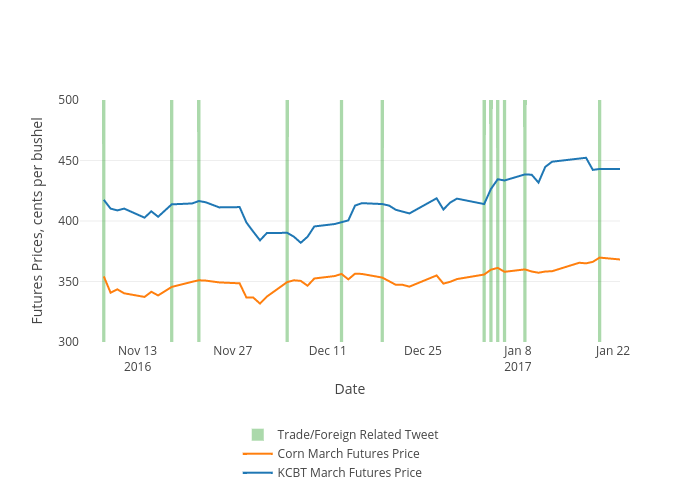
Ageconmt's interactive graph and data of "Futures Prices, cents per bushel vs Date" is a line chart, showing KCBT March Futures Price, Corn March Futures Price, Trade/Foreign Related Tweet; with Date in the x-axis and Futures Prices, cents per bushel in the y-axis.. The x-axis shows values from 2016-11-04 12:00 to 2017-01-23. The y-axis shows values from 300 to 500.