Edit chart
Loading graph
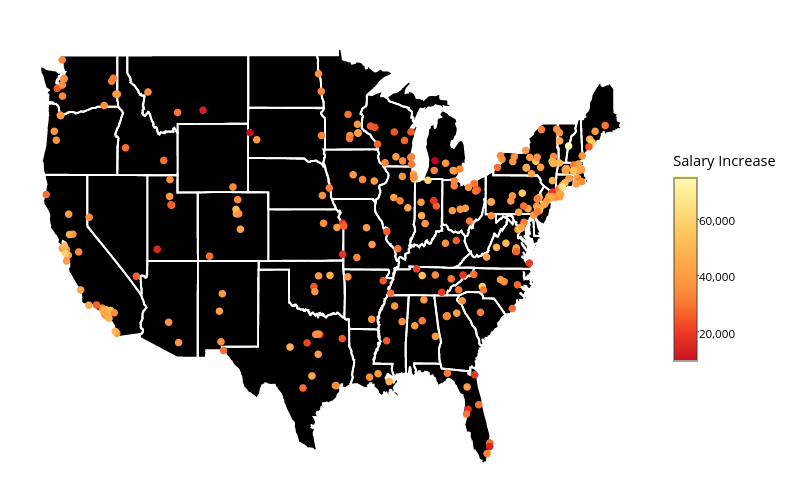
Agisga's interactive graph and data of ", , 99_6bd2469f05331620fed7cafaa60ea9ec" is a filled line chart, showing , , 99_6bd2469f05331620fed7cafaa60ea9ec. The x-axis shows values from -127.56503944397 to -64.1237194061279. The y-axis shows values from 23.9172634124756 to 50.5958972930908.