Edit chart
Loading graph
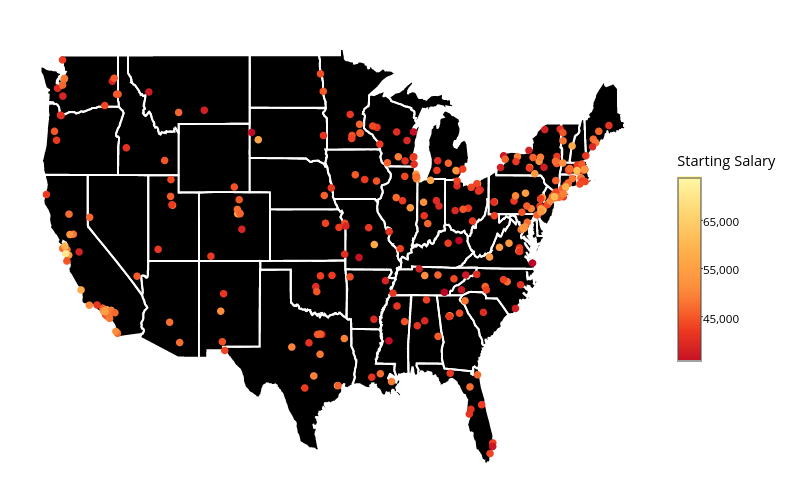
Agisga's interactive graph and data of ", , 99_8f6f2bf936fe8918a684bc2dd101faaa" is a filled line chart, showing , , 99_8f6f2bf936fe8918a684bc2dd101faaa. The x-axis shows values from -127.56503944397 to -64.1237194061279. The y-axis shows values from 23.9172634124756 to 50.5958972930908.