Edit chart
Loading graph
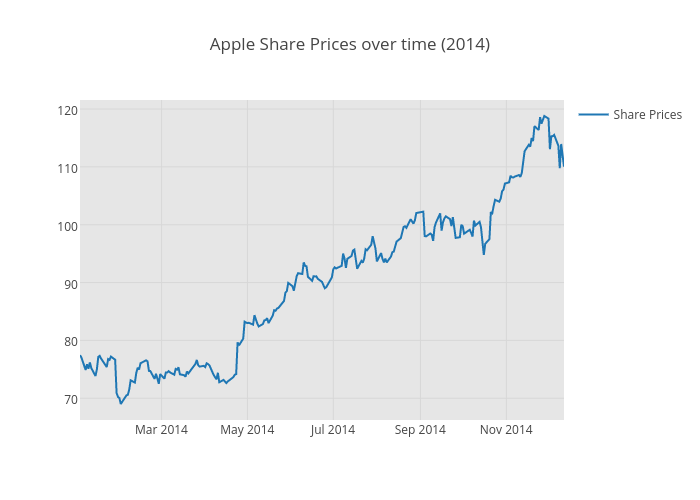
Albertocavallo's interactive graph and data of "Apple Share Prices over time (2014)" is a scatter chart, showing Share Prices; with time in the x-axis. The x-axis shows values from 1388638800000 to 1418360400000. The y-axis shows values from 66.23837748055556 to 121.56498686944444.