Edit chart
Loading graph
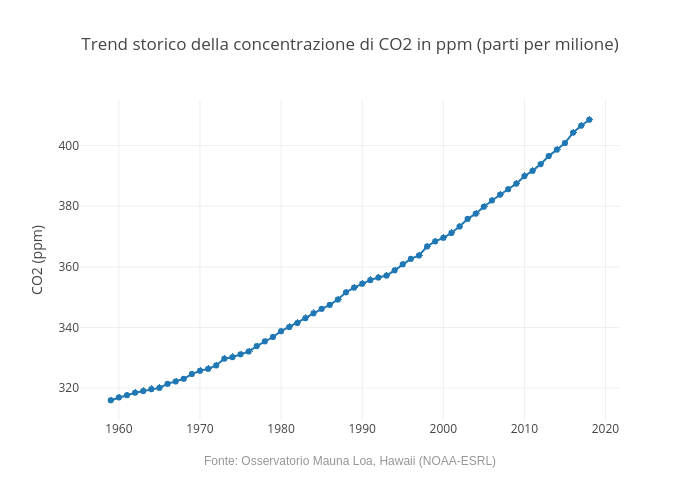
Andrea.cesarini85's interactive graph and data of "Trend storico della concentrazione di CO2 in ppm (parti per milione)" is a line chart, showing CO2 Trend; with CO2 (ppm) in the y-axis. The x-axis shows values from 0 to 0. The y-axis shows values from 0 to 0. This visualization has the following annotation: Fonte: Osservatorio Mauna Loa, Hawaii (NOAA-ESRL)