Edit chart
Loading graph
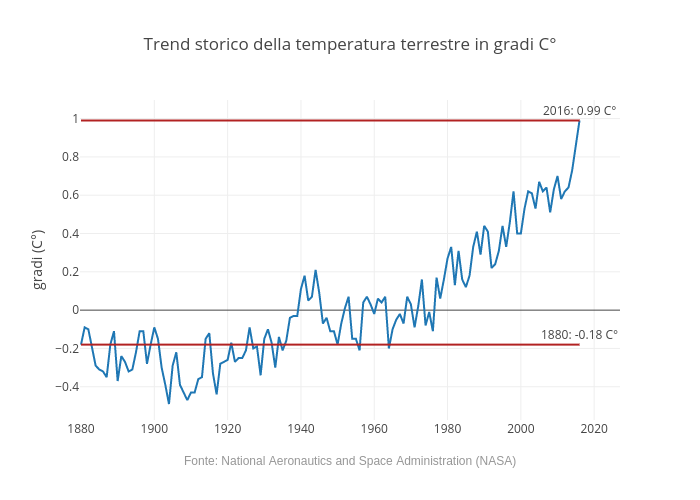
Andrea.cesarini85's interactive graph and data of "Trend storico della temperatura terrestre in gradi C°" is a line chart; with gradi (C°) in the y-axis. The x-axis shows values from 0 to 0. The y-axis shows values from 0 to 0. This visualization has the following annotations: Fonte: National Aeronautics and Space Administration (NASA); 1880: -0.18 C°; 2016: 0.99 C°