Edit chart
Loading graph
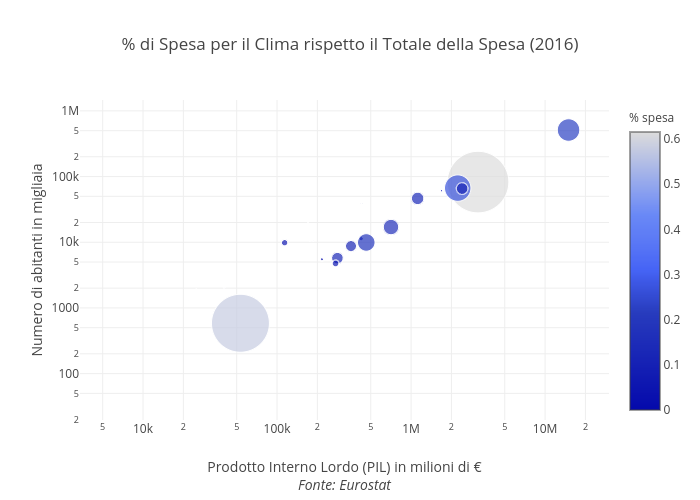
Andrea.cesarini85's interactive graph and data of "% di Spesa per il Clima rispetto il Totale della Spesa (2016)" is a scatter chart; with Prodotto Interno Lordo (PIL) in milioni di €Fonte: Eurostat in the x-axis and Numero di abitanti in migliaia in the y-axis.. The x-axis shows values from 0 to 0. The y-axis shows values from 0 to 0.