Edit chart
Loading graph
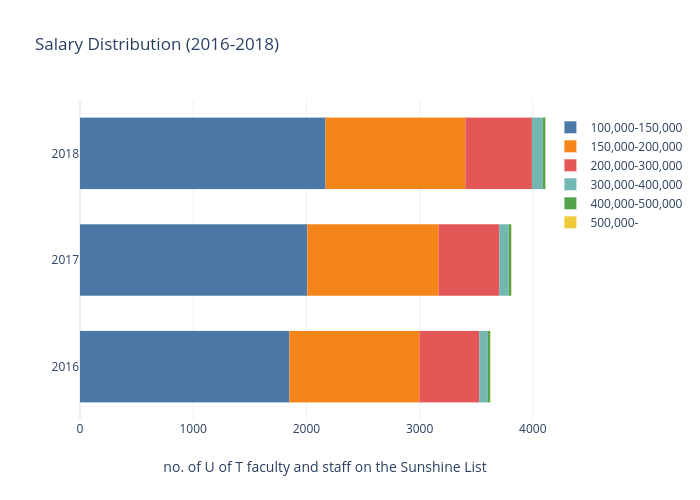
Andytakagi's interactive graph and data of "Salary Distribution (2016-2018)" is a , showing 100,000-150,000, 150,000-200,000, 200,000-300,000, 300,000-400,000, 400,000-500,000, 500,000-; with no. of U of T faculty and staff on the Sunshine List in the x-axis. The x-axis shows values from 0 to 4328.421052631579. The y-axis shows values from 2015.5 to 2018.5.