Edit chart
Loading graph
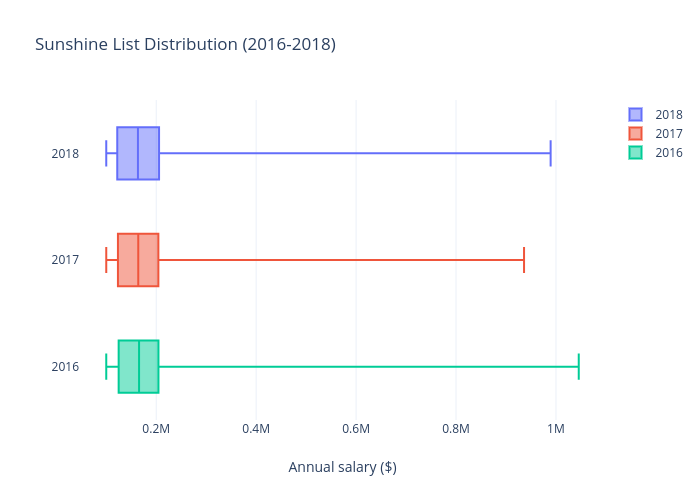
Andytakagi's interactive graph and data of "Sunshine List Distribution (2016-2018)" is a box plot, showing 2018, 2017, 2016; with Annual salary ($) in the x-axis. The x-axis shows values from 47467.65333333335 to 1098114.9866666666. The y-axis shows values from 2015.5 to 2018.5.