Edit chart
Loading graph
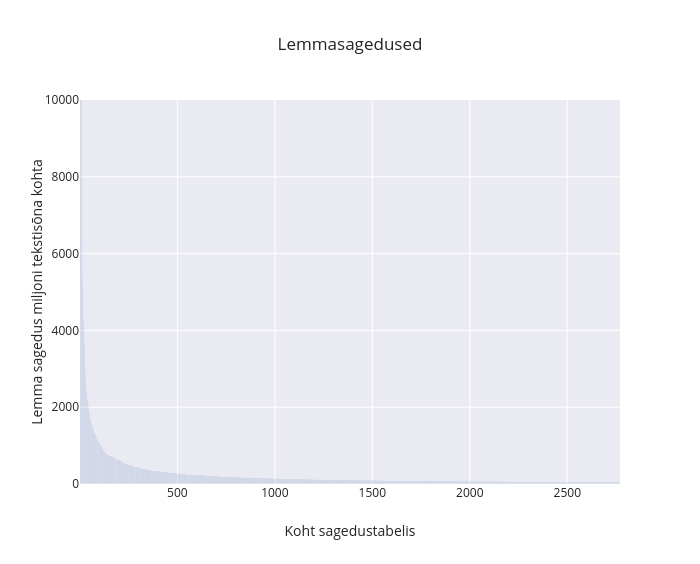
Arvitavast's interactive graph and data of "Lemmasagedused" is a bar chart, showing sagedus; with Koht sagedustabelis in the x-axis and Lemma sagedus miljoni tekstisõna kohta in the y-axis.. The x-axis shows values from 0.5 to 2770.5. The y-axis shows values from 0 to 10000.