Edit chart
Loading graph
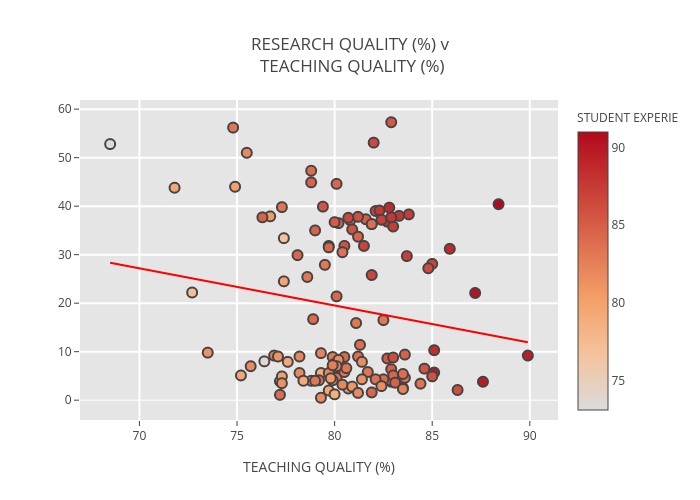
Billatnapier's interactive graph and data of "RESEARCH QUALITY (%) v TEACHING QUALITY (%)" is a scatter chart, showing Grad:-0.765142332288; with TEACHING QUALITY (%) in the x-axis. The x-axis shows values from 0 to 0. The y-axis shows values from 0 to 0.