Edit chart
Loading graph
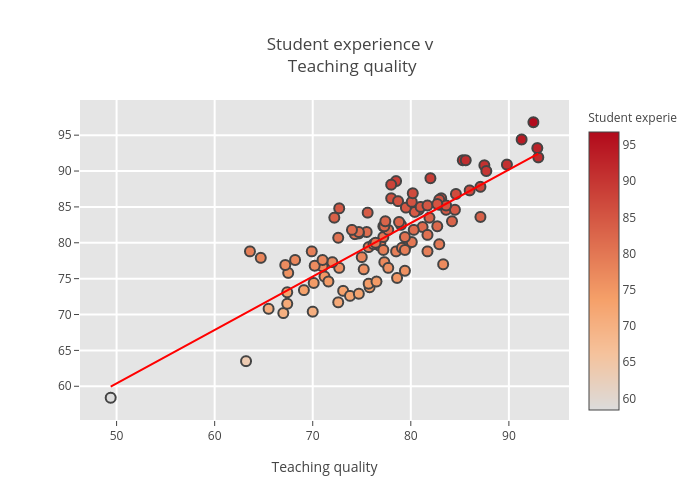
Billatnapier's interactive graph and data of "Student experience v Teaching quality" is a scatter chart, showing Grad:0.745132663912; with Teaching quality in the x-axis. The x-axis shows values from 0 to 0. The y-axis shows values from 0 to 0.