Edit chart
Loading graph
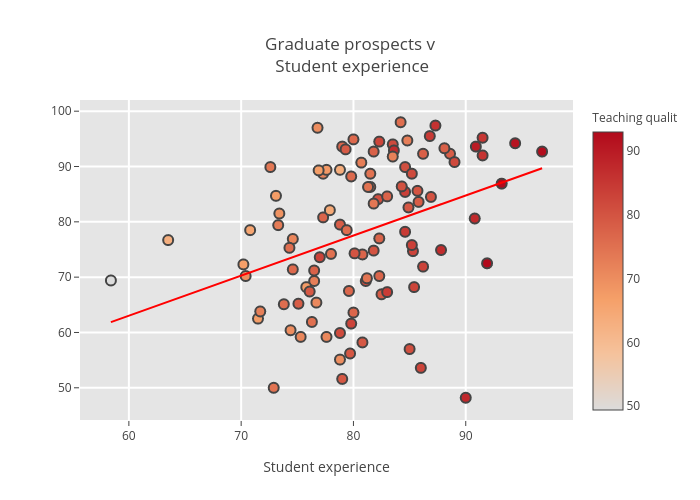
Billatnapier's interactive graph and data of "Graduate prospects v Student experience" is a scatter chart, showing Grad:0.724371900158; with Student experience in the x-axis. The x-axis shows values from 0 to 0. The y-axis shows values from 0 to 0.