Edit chart
Loading graph
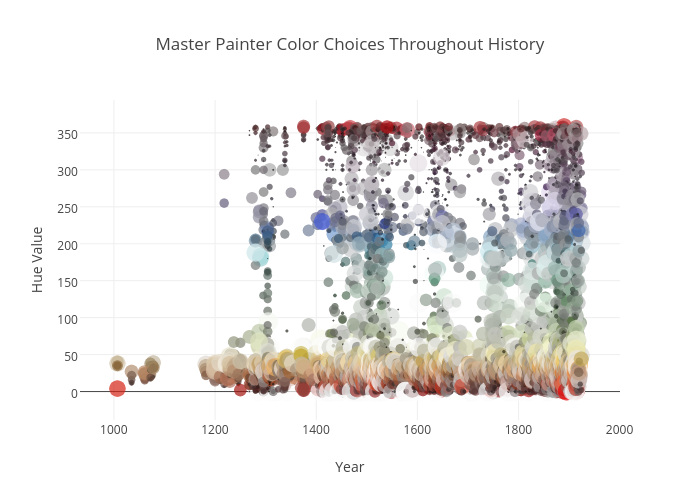
Brandnewpeterson's interactive graph and data of "Master Painter Color Choices Throughout History" is a scatter chart, showing trace_0, trace 1, trace 2; with Year in the x-axis and Hue Value in the y-axis.. The x-axis shows values from 939.9038345713712 to 1993.1802850833167. The y-axis shows values from -35.062697972997384 to 391.630565826398.