Edit chart
Loading graph
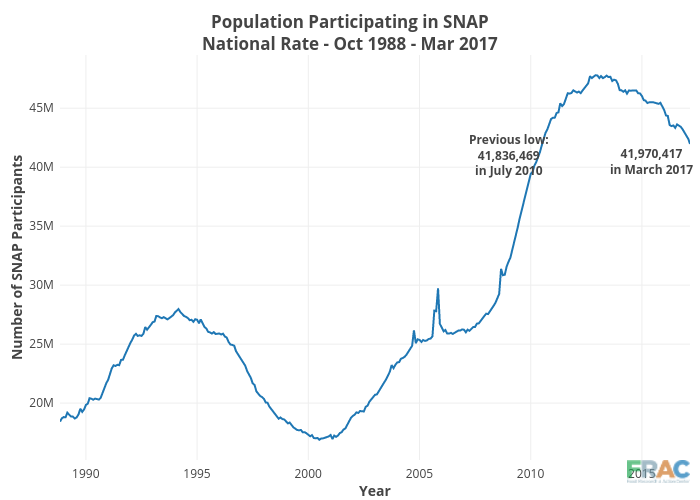
Cbsutton's interactive graph and data of "Population Participating in SNAPNational Rate - Oct 1988 - Mar 2017" is a line chart, showing y; with Year in the x-axis and Number of SNAP Participants in the y-axis.. The x-axis shows values from 1988-11-01 to 2017-03-01. The y-axis shows values from 15178538.055555556 to 49508556.94444445. This visualization has the following annotations: 41,970,417<br>in March 2017; Previous low:<br>41,836,469<br>in July 2010